To build good apps, you must be able to debug effectively. You must be able to use all of your available tools.
New API in Angular 9
It comes directly from the Ivy internal methods. Ivy is the code name for Angular’s next-generation compilation and rendering pipeline. With the version 9 release of Angular, the new compiler and runtime instructions are used by default instead of the older compiler and runtime, known as View Engine.
Where can I access the new methods?
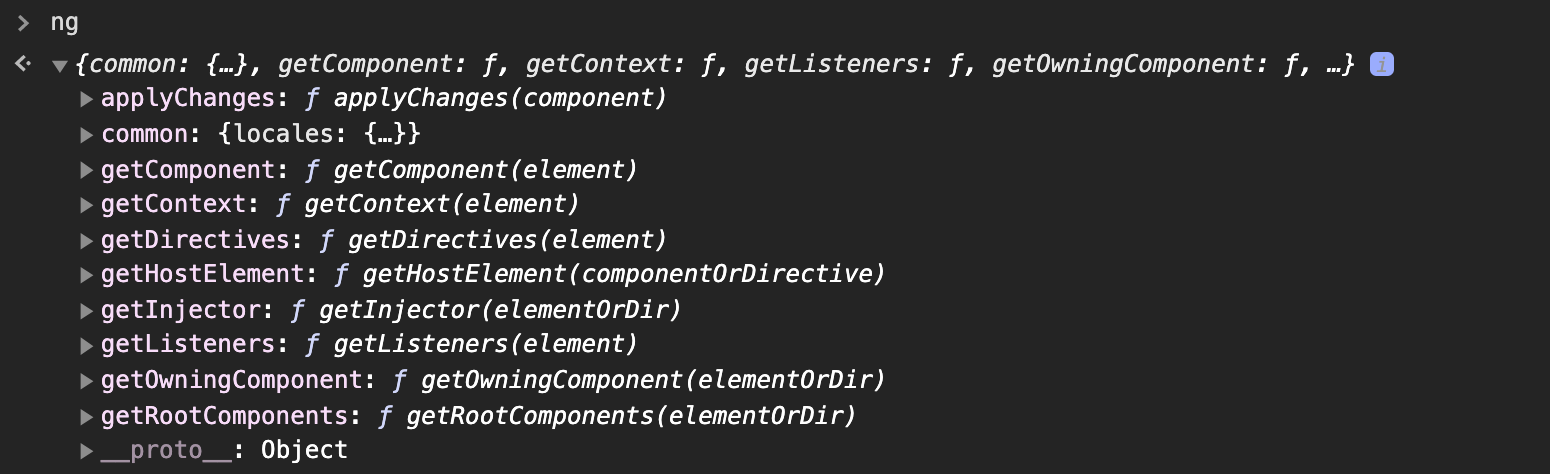
Run your Angular application on local system and write ng in your Google Chrome Console and you will be able to see all the methods.
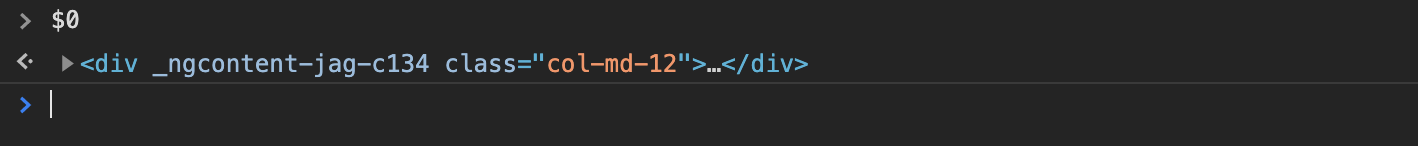
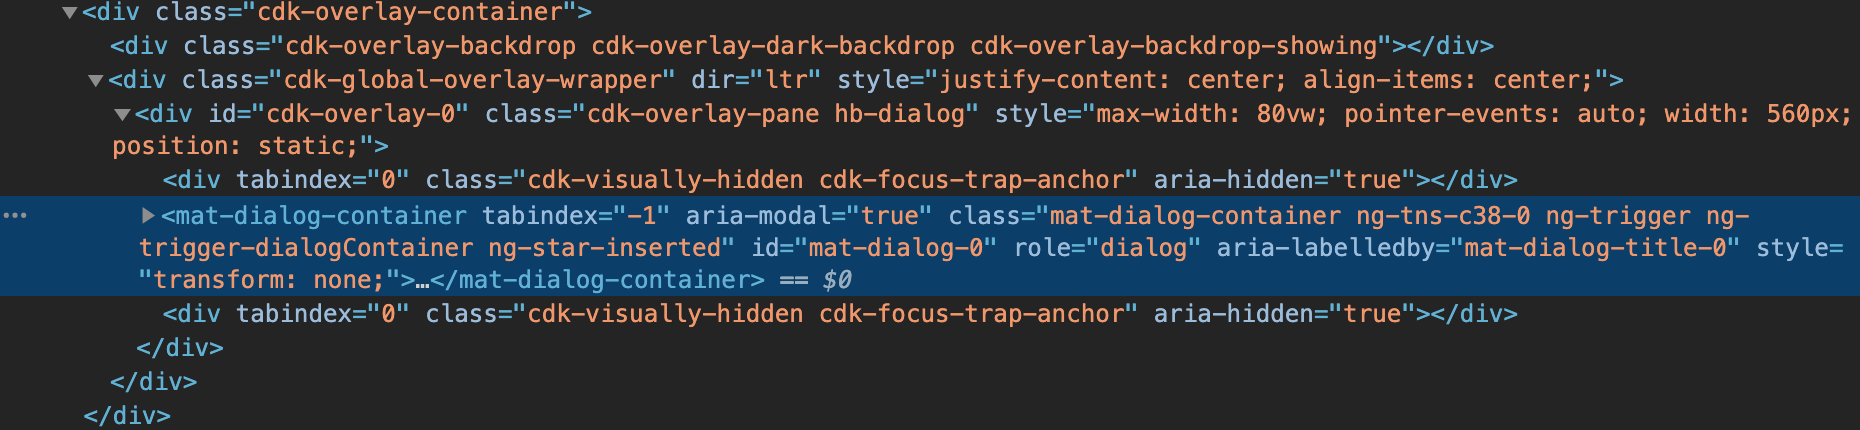
Before we start, do you know what is $0?
Using $0, you will be able to reference any element using Inspect Element.
If you don’t select any element and type $0 in the Inspector, you will get undefined.

But if you select an element, you will get reference of that element.
Let’s go through the ng methods.
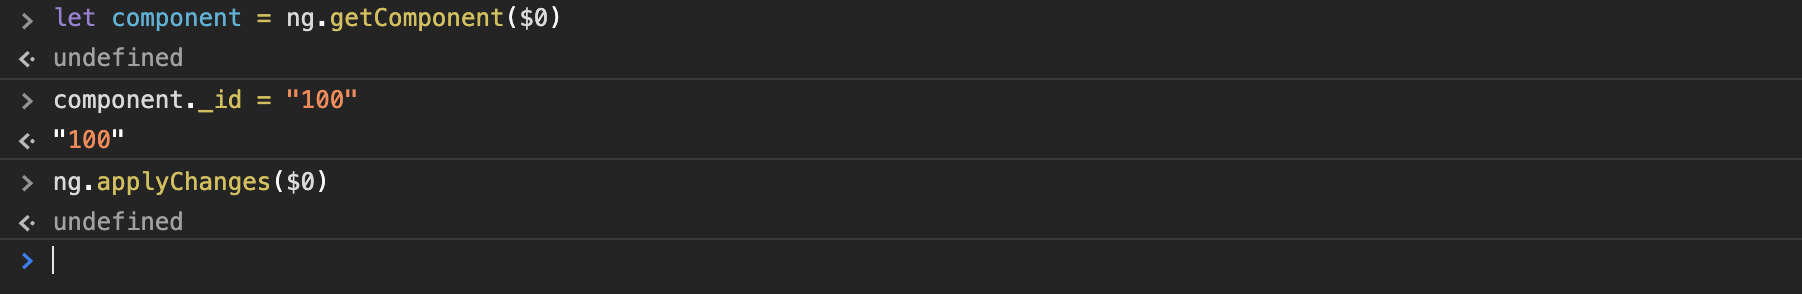
ng.getComponent – retrieves the component from an HTML element.

ng.getDirectives – retrieves an array of directives from an HTML element.

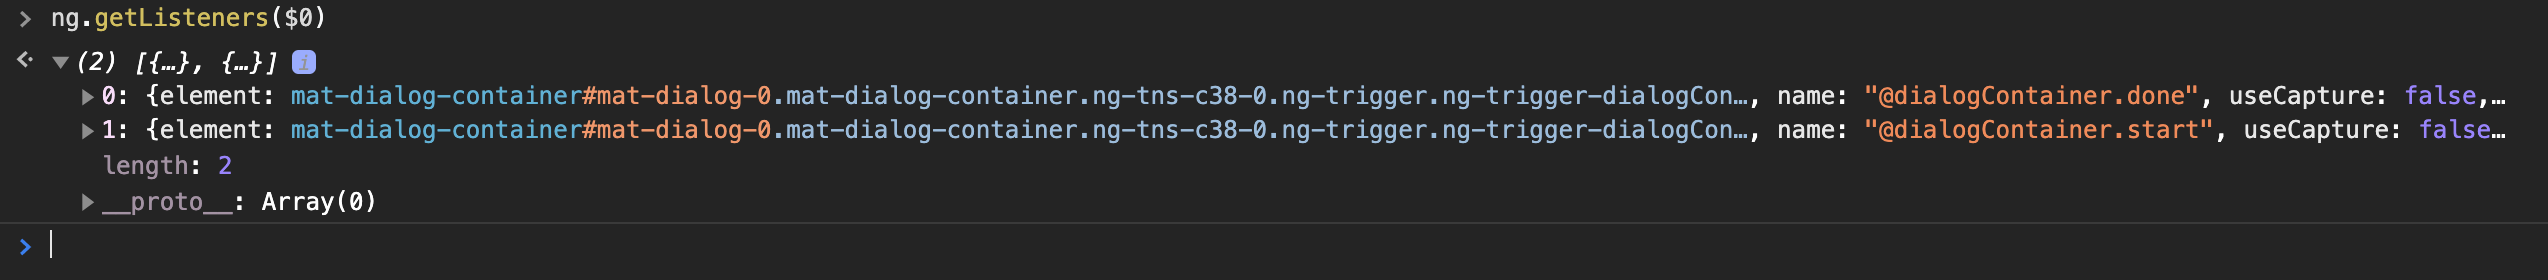
ng.getListeners – returns an array of both HTML(click events) and Host Listeners from and HTML element.
ng.applyChanges – triggers change detection for the component or directive.
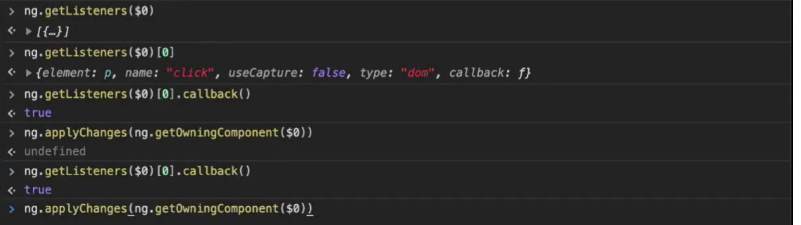
ng.getOwningComponent – returns the parent component for the HTML element.

ng.getContext – returns the context of an *ngIf or *ngFor for the HTML element.

ng.getRootComponents – Retrieves all root components associated with a DOM element, directive or component instance.

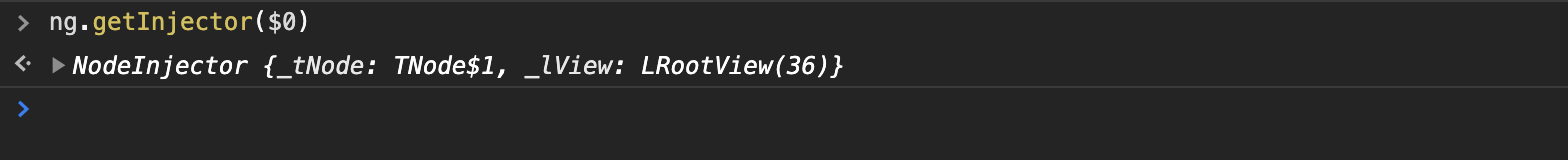
ng.getInjector – Retrieves an Injector associated with an element, component or directive instance.