
Running Rails 5 on AWS EC2, Bundler, Sidekiq & PostgreSQL.
The Problem
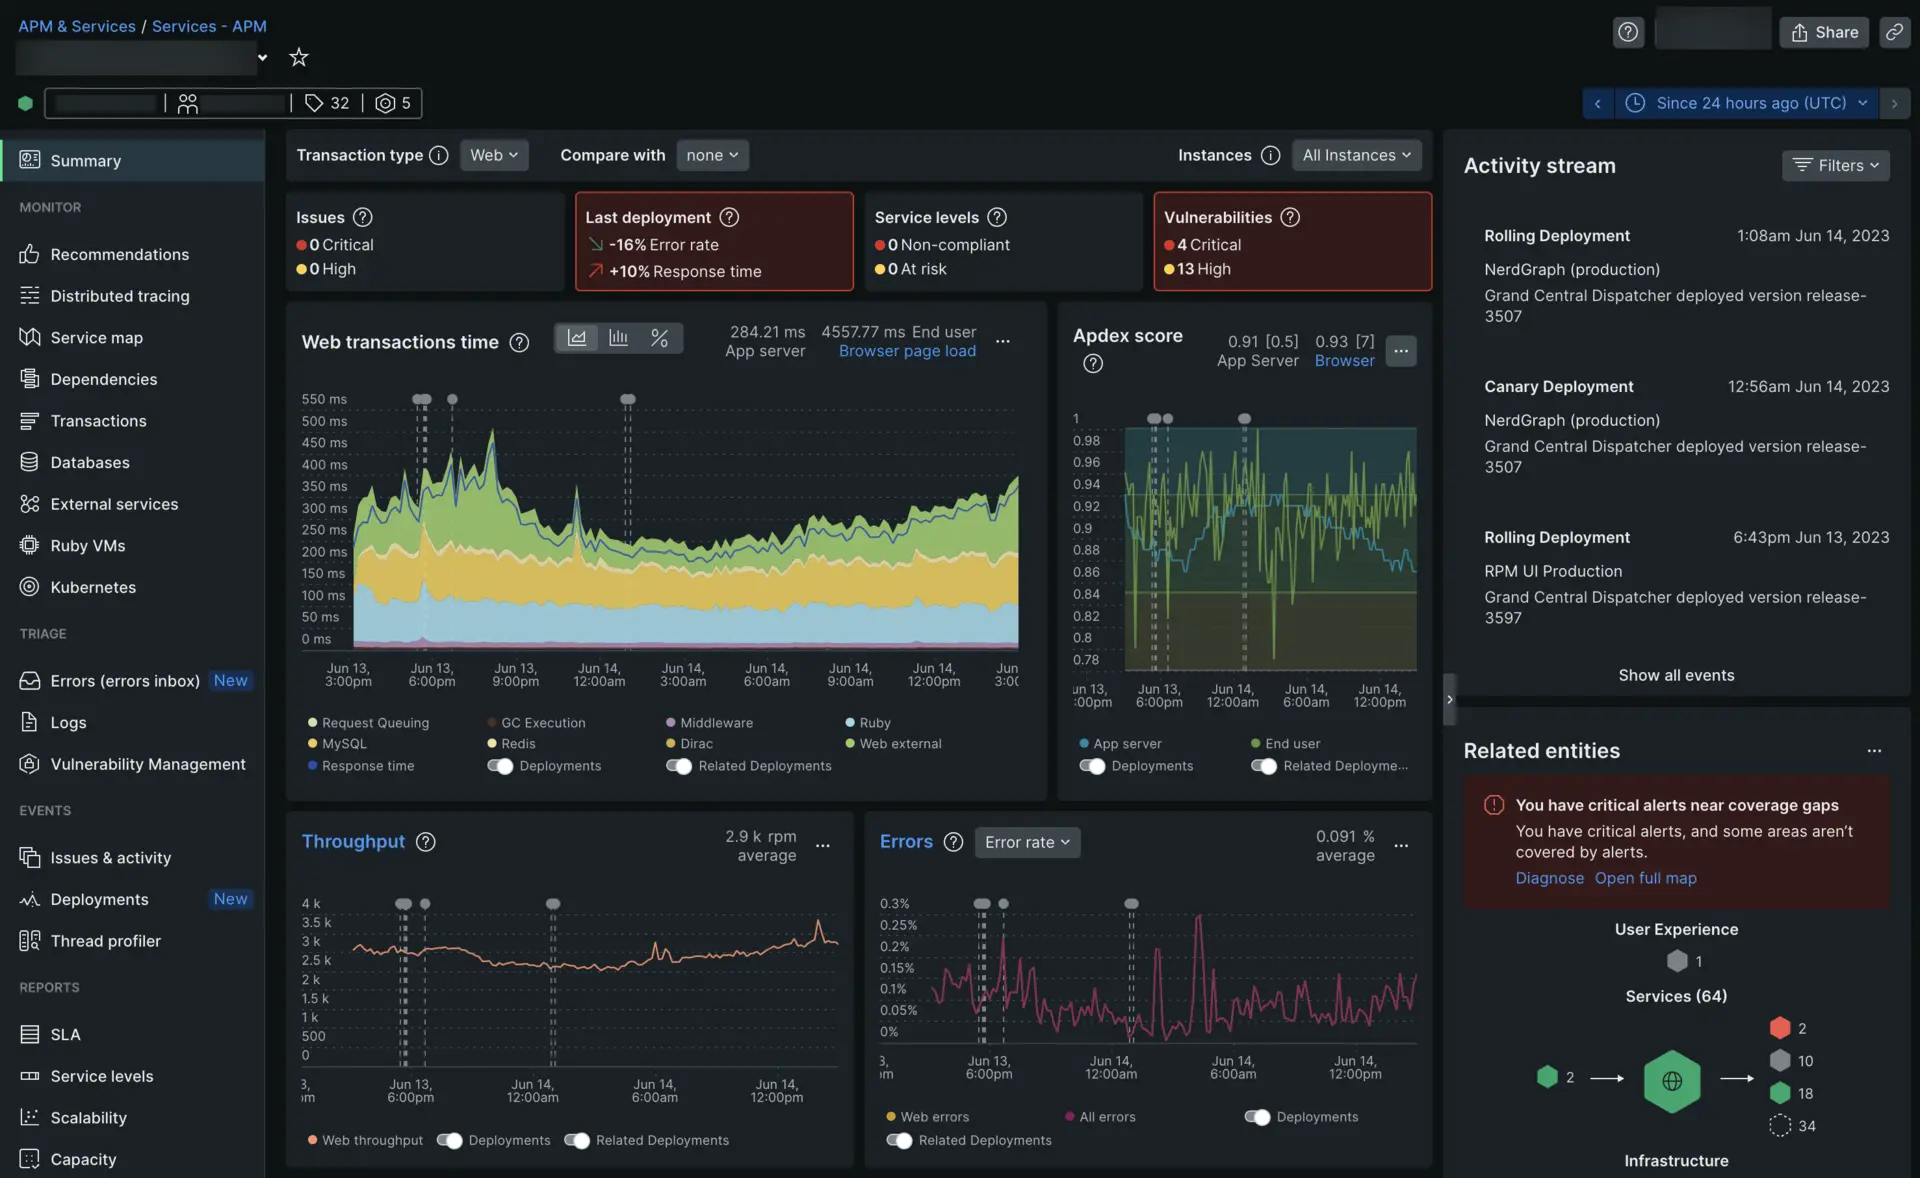
We had logs. We had uptime checks. But we had to figure out which endpoint is slow, why is memory climbing, did this deploy break anything? That is the reason we put observability into out application.
Why New Relic
We looked at a few alternatives before moving with New Relic:
Datadog → great product but pricing is high. It is per-host based and once you add log ingestion + APM + infra monitoring, costs increase fast. We were looking at $800 – 1,400/month for our setup.
ELK Stack (Elasticsearch, Logstash, Kibana) → great for log search and we seriously considered it just for logging. But running ELK on AWS yourself means managing Elasticsearch clusters, lifecycle policies and more todos. It is, in my opinion, a second product to maintain.
Prometheus + Grafana (self-hosted) → free and flexible but someone has to own it. Setting up exporters, writing recording rules, managing Alertmanager, keeping Grafana dashboards in sync. So, it is a platform engineering job not a small task. We are a product teama and we didn’t want to be on-call for our monitoring stack.
New Relic → one agent, one platform, one bill. APM, logs, infra and alerts all share the same data model so you can correlate a slow request to a specific SQL query to a CPU spike on the host in one click. The free tier (100GB/month ingest) gave us the starting point in implementing Observability in our App.
We chose New Relic because:
- Rails agent is plug-and-play → auto-instruments ActiveRecord, controllers, Sidekiq, Redis, outbound HTTP
- One platform → APM, logs, infra, alerts, dashboards in one place
- Free tier → 100 GB/month ingest, 1 full-access user, all features
Setup on Rails 5 + AWS
1. Add the gem
# Gemfile
gem 'newrelic_rpm', '~> 9.10'
bundle installRails 5 works fine with the
newrelic_rpm9.x agent. No special compatibility shim needed.
2. Generate config
bundle exec newrelic install --license_key=YOUR_KEY 'MyApp'Or create config/newrelic.yml manually:
common: &default_settings
  license_key: <%= ENV['NEW_RELIC_LICENSE_KEY'] %>
  app_name: <%= ENV['NEW_RELIC_APP_NAME'] || 'MyApp' %>
  distributed_tracing:
    enabled: true
  transaction_tracer:
    enabled: true
    record_sql: obfuscated        # never use 'raw' in production
    explain_enabled: true
    explain_threshold: 0.5
  error_collector:
    enabled: true
    ignore_errors: "ActionController::RoutingError"
  attributes:
    exclude:
      - request.parameters.password
      - request.parameters.token

production:
  <<: *default_settings
  monitor_mode: true

staging:
  <<: *default_settings
  app_name: 'MyApp (Staging)'
  monitor_mode: true

development:
  <<: *default_settings
  monitor_mode: false

test:
  <<: *default_settings
  monitor_mode: false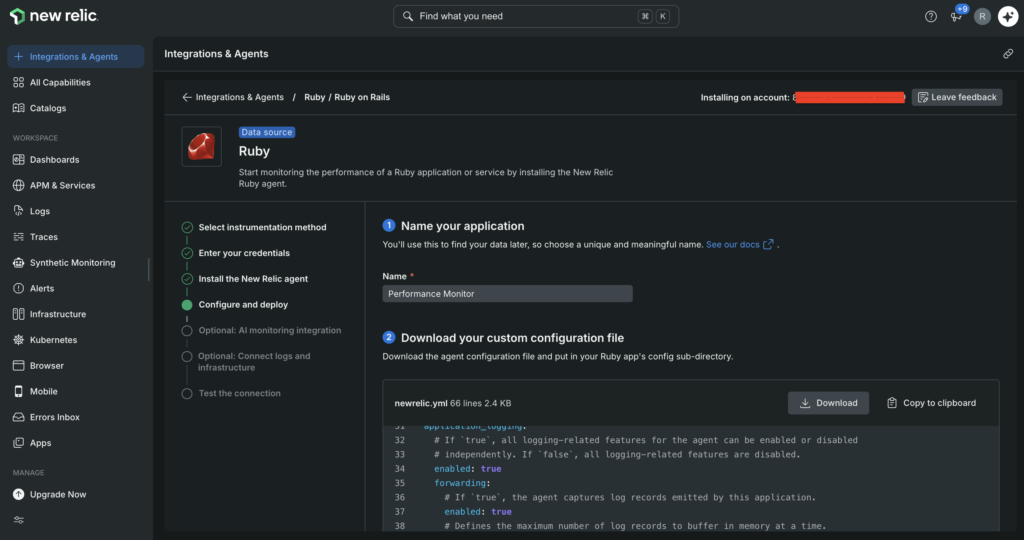
3. Environment variables on AWS
Set these in your EC2 instance environment, Systems Manager Parameter Store or via your deploy tool:
export NEW_RELIC_LICENSE_KEY=NRAK-xxxxxxxxxxxx
export NEW_RELIC_APP_NAME=MyApp
With Capistrano, add them to your shared .env or use dotenv-rails.
4. OS-level log forwarding (New Relic Infrastructure agent)
Install the Infrastructure agent on your EC2 instances:
# Amazon Linux
curl -Ls https://download.newrelic.com/infrastructure_agent/linux/yum/el/7/x86_64/newrelic-infra.repo \
  | sudo tee /etc/yum.repos.d/newrelic-infra.repo
sudo yum install newrelic-infra -y
Configure your license key:
# /etc/newrelic-infra.yml
license_key: YOUR_LICENSE_KEY
Then set up log forwarding for Rails logs:
# /etc/newrelic-infra/logging.d/rails.yml
logs:
  - name: rails-production
    file: /var/www/myapp/current/log/production.log
    attributes:
      service: rails-app
      environment: production

  - name: nginx-access
    file: /var/log/nginx/access.log
    attributes:
      service: nginx

  - name: syslog
    file: /var/log/messages
    attributes:
      service: system
sudo systemctl enable newrelic-infra
sudo systemctl start newrelic-infraAll three log streams: Rails app, Nginx and OS will show up in New Relic Logs, correlated with APM traces by timestamp.
5. Sidekiq
Auto-instrumented once the gem is loaded. For better visibility, add context to workers:
class MyWorker
  include Sidekiq::Worker

  def perform(user_id)
    NewRelic::Agent.add_custom_attributes(user_id: user_id)
    # job logic
  end
end
6. Deploy markers
Add this to your Capistrano deploy or CI pipeline so every deploy shows as a vertical line on your charts:
curl -X POST "https://api.newrelic.com/v2/applications/$NEW_RELIC_APP_ID/deployments.json" \
  -H "X-Api-Key: $NEW_RELIC_API_KEY" \
  -H "Content-Type: application/json" \
  -d "{\"deployment\": {\"revision\": \"$GIT_SHA\", \"description\": \"$DEPLOY_MESSAGE\"}}"
What Gets Auto-Instrumented
Zero extra code for:
- Every controller action (response time, throughput or error rate)
- Every ActiveRecord query (duration, N+1 detection, slow query explain plans)
- Sidekiq / DelayedJob workers
- Redis
- ActionMailer
Dashboards we use daily
App Health (NRQL)
-- Apdex
SELECT apdex(duration, t: 0.5) FROM Transaction WHERE appName = 'MyApp' TIMESERIES

-- Error rate
SELECT percentage(count(*), WHERE error IS true) FROM Transaction TIMESERIES

-- P95 response time by endpoint
SELECT percentile(duration, 95) FROM Transaction FACET name LIMIT 10
Database
-- Slowest queries
SELECT average(duration)*1000 AS 'ms', count(*) AS 'calls'
FROM Span
WHERE span.kind = 'client' AND db.system IS NOT NULL
FACET db.statement LIMIT 15 SINCE 1 day ago

-- N+1 candidates
SELECT count(*) AS 'calls', average(duration)*1000 AS 'ms'
FROM Span
WHERE db.statement IS NOT NULL
FACET db.statement
SINCE 1 hour ago
LIMIT 20
Background Jobs
-- Job failure rate
SELECT percentage(count(*), WHERE error IS true)
FROM Transaction
WHERE transactionType = 'Other'
FACET name TIMESERIES

-- P95 job duration
SELECT percentile(duration, 95)
FROM Transaction
WHERE transactionType = 'Other'
FACET name
SINCE 1 day ago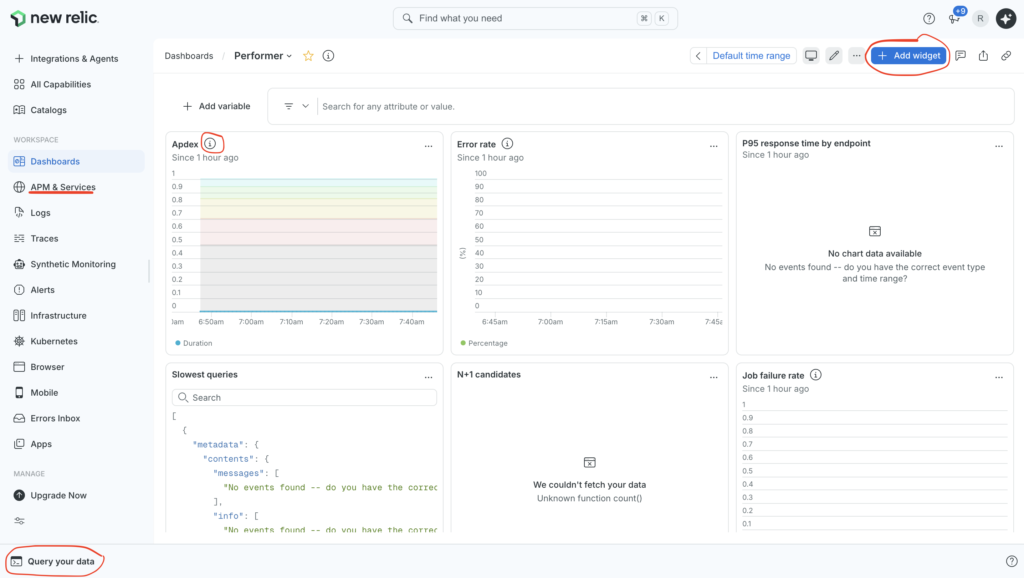
Infrastructure (EC2)
You can use the built-in UI for CPU, memory, disk I/O, network per instance. It correlates directly with APM data so you can see if a response time spike matches a CPU spike.
Alerts we keep
| Condition | Threshold | Action |
|---|---|---|
| Error rate | > 5% for 5 min | Slack Alert |
| P99 response time | > 8s for 5 min | Slack Alert |
| Apdex | < 0.75 for 10 min | Slack Alert |
| Sidekiq queue depth | > 500 jobs | Slack warning |
| EC2 memory | > 85% for 15 min | Slack warning |
| External API errors | > 10% for 5 min | Slack warning |
Best Practices
record_sql: obfuscatedalways in production, you still see query structure, not PII- Filter sensitive params in
newrelic.ymlfor passwords, tokens, credit card fields - Don’t forward debug logs, set Rails log level to
:warnin production; saves 30–40% ingest - Use deploy markers, the single most useful thing for correlating deploys to regressions
- Add custom attributes for business context (user ID, plan, feature flag), it makes NRQL queries actually useful